LLM Prompting Experiment 3: Building a Dashboard UI
The Ruoom team has run 2 experiments with AI large language model (LLM) driven software development: Google Calendar Import and Google Calendar Export. Both of these experiments challenged AI to develop full-stack software features (at a small scale), and found reasonable success with plenty to critique regarding missing or oddly designed code. However, the biggest critique the team had was inconsistency in the UI and incomplete or unhelpful UX flows.
In this experiment, the team will focus purely on the UI of a new feature: an analytics dashboard for a business management tool.
Our open source code features a dashboard on the home page which is left blank so as to allow users to develop their own custom visualizations. For a dashboard to be useful, it has to aggregate the most important information for a given use case or user – making it more useful to leave this blank than to provide something that doesn’t fit the situation.
The team will provide some high level guidance for the LLM and explore what it is capable of providing. Internet forums such as Reddit’s r/vibecoding page are full of examples of AI-built dashboards that visually blend together. Our CTO, Kevin, will team up with our lead UI/UX designer, Jasmina, to test the limits of LLM UI generation. At each stage in the dashboard build, our designer will provide her feedback, which the team will incorporate into the next prompts.
Initial Dashboard Build
The team started with a simple prompt:
Prompt:
Design an exciting set of dashboard widgets that are interactive and configurable on this page, to demonstrate the type of data visualization that is possible. Please analyze the available models and extrapolate similar types of data that might be part of this business management & booking platform.
Response:
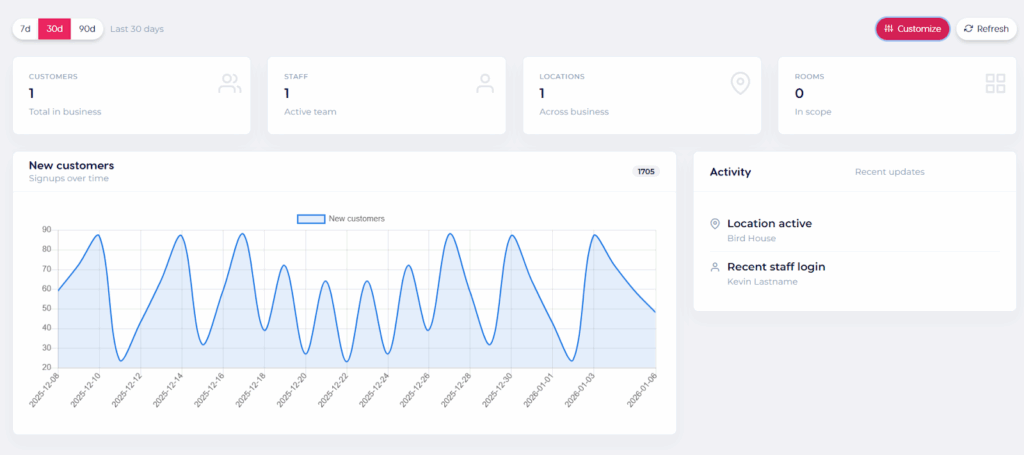
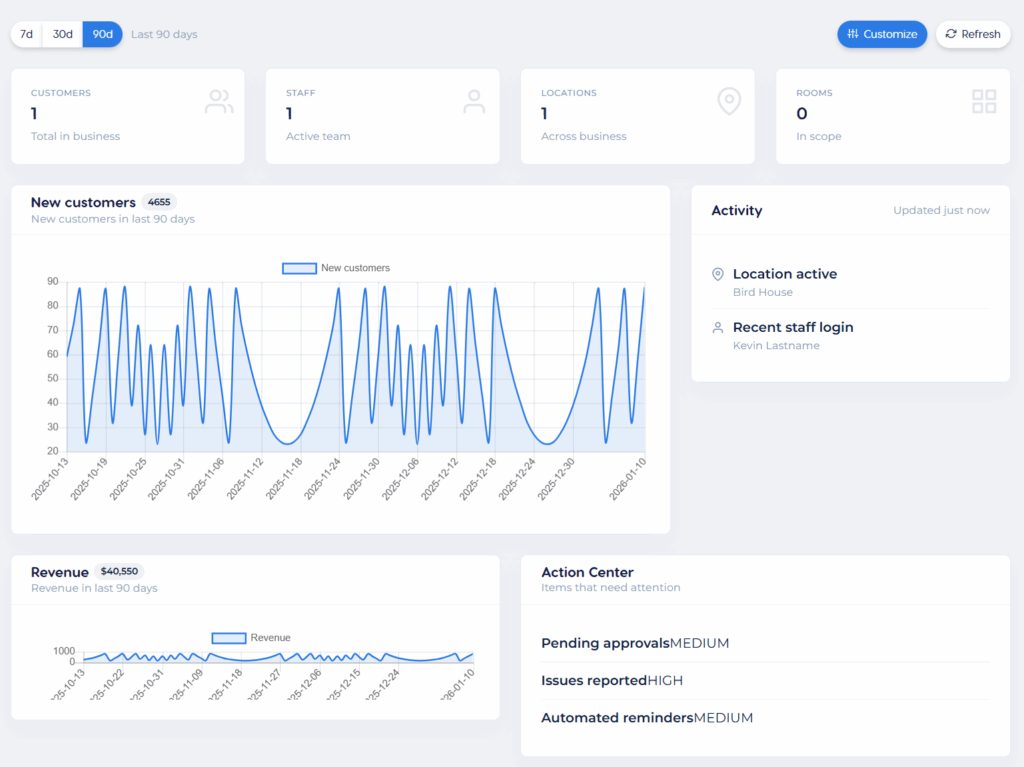
Initial dashboard UI:
The 3d/30d/90d selection changes the window of the data shown in the plot.
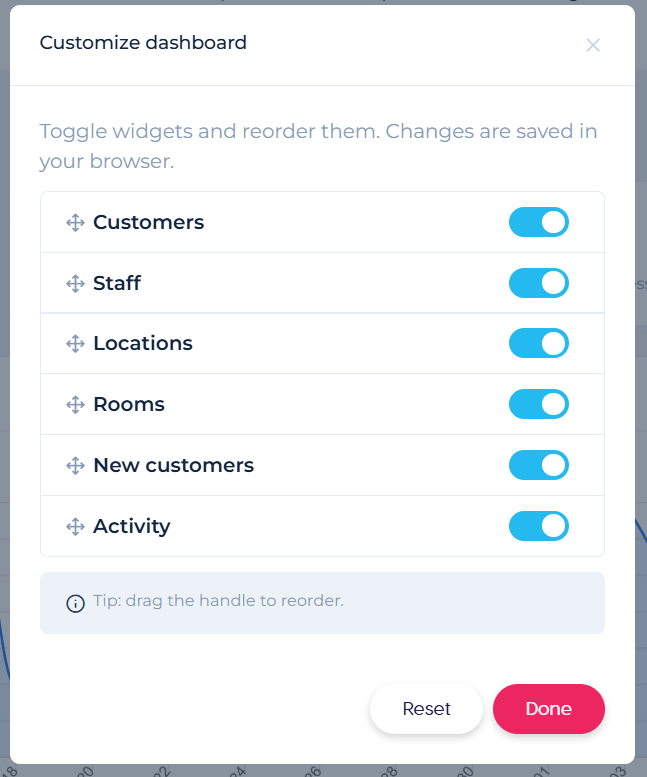
Clicking the “Customize” button leads to the following modal:
Using this tool, the user can reorder the widgets and disable any not needed.
Jasmina Feedback + Next Prompt:
Prompt:
The dashboard you sent looks really good overall. However, I’d replace the pink accents with blue (e.g., the “30d” and “Customize” elements). The pink feels quite strong and is usually better suited for final/primary actions such as “Done,” “Submit,” “Add,” “Create” and similar.
Two small notes as well:
It’s not clear what the number “1705” represents.
“Recent updates” feels a bit oddly placed, so its purpose isn’t immediately clear. If it’s meant to indicate when the Activity section was last updated, I’d move it to the far right and label it more explicitly, e.g., “Updated X hours ago.”
Please give me another version.
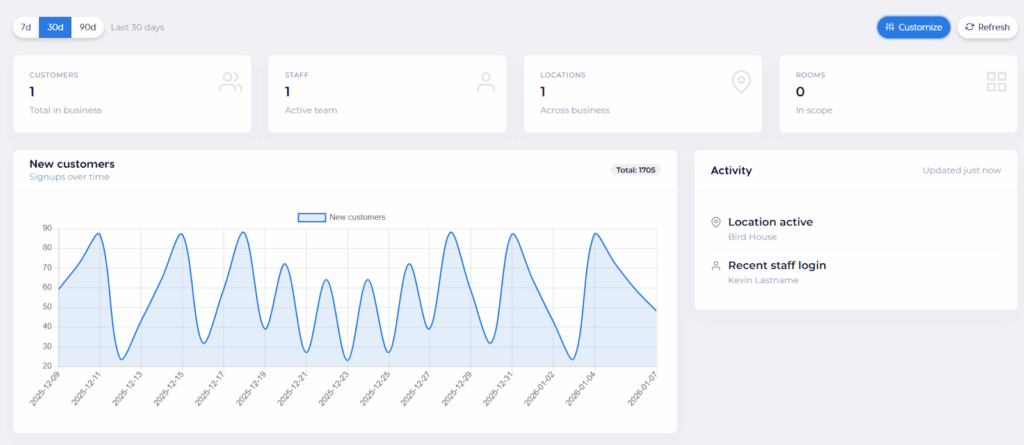
Response:
Truthfully, the “total” number within the plot is still confusing. We’ll fix that one a little later.
Augmented Dashboard Features
Overall, the dashboard is functional but it is a little boring and limited. We will ask our designer to challenge the LLM a little more by requesting more from the dashboard design.
Jasmina Feedback + Next Prompt:
Prompt:
The goal of the new dashboard should be to provide all critical information ‘at a glance,’ allowing users to see exactly what’s happening without having to dig through various menus.
To achieve this, it would be useful to include:
Revenue Tracking: Displaying daily or monthly earnings accompanied by a small ‘sparkline’ trend graph for quick visual analysis.
Action Center: A dedicated hub for items requiring immediate attention. This would include:
Pending Approvals: Quick access to requests waiting for a sign-off.
Issue Reporting: Visual alerts for reported problems or maintenance tasks that need to be resolved.
Automated Reminders: Prompts for sending out invoices, pending invitations, or important follow-ups.
That is what comes to mind for now. However, it’s possible there are other important pieces of information that could be added.
Lastly, the “Total: X” new customers still isn’t clear. Can you move it so it corresponds to the “New Customers” label on the left, and indicate somehow that it is for the period shown?
Response:
(Truthfully, we had to ask the LLM to execute twice. The first time, it only half-completed its new widgets, leaving them blank with no data. The following screenshot was produced after we asked it to please finish your work thank you very much)
Hi, it’s Kevin.
Ok, Before we even pass this to the designer, there are some obvious issues. First, clearly the data is some AI-generated pattern which looks weird. It’s distracting so we’ll want to fix this.
Second, the Action Center makes ZERO sense at all. It’s clear the LLM doesn’t understand what should go on in this widget. Why don’t we try again:
Prompt:
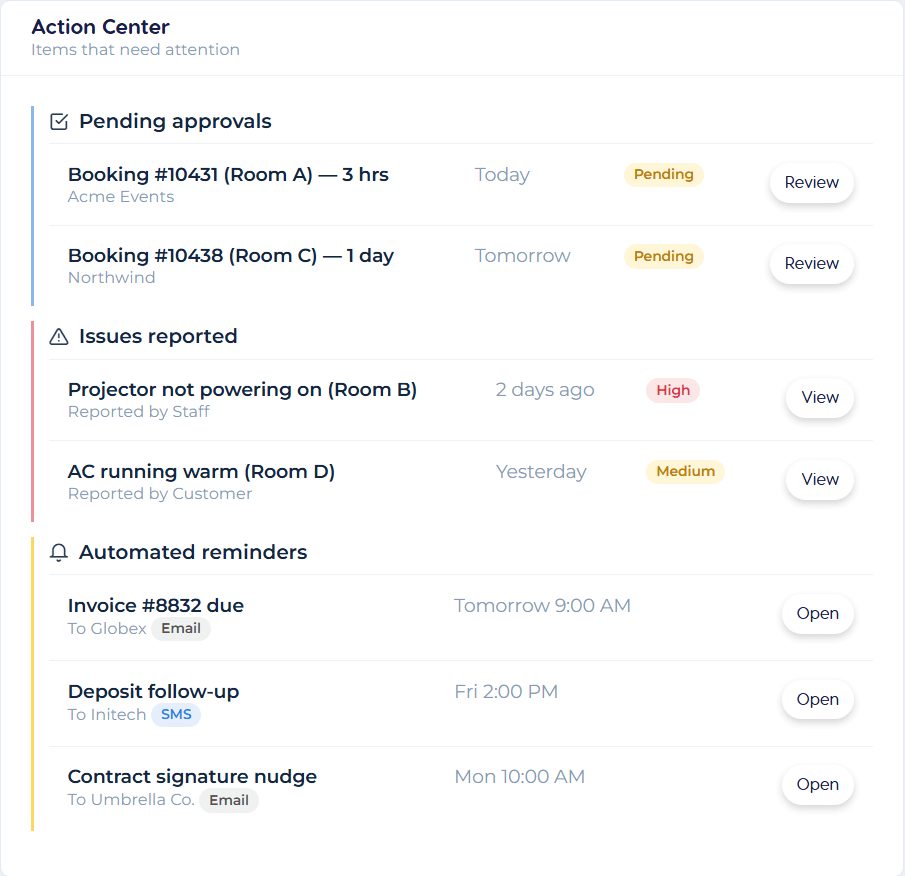
The Action Center has a strange format – can you make that into a properly formatted table? Actually, a set of 3 tables, one for each category (pending approvals, issues reported, and automated reminders). Each of these are types of information, for which I need you to make up a small set of items that can elegantly be presented within each category.
Also, the graphs for revenue and new customers look like the same datasets, and they both look like weird periodic functions. Can you make the data appear random, and different for each?
Response:
Much better!
Improved Configurability of Dashboard Widgets
Let’s really challenge the LLM now. The approach it took to allowing users to edit the dashboard widgets via a menu was clumsy before – a separate menu for selecting and deselecting widgets. We want to challenge the LLM to make the widgets editable in a more drag-and-drop fashion.
Prompt:
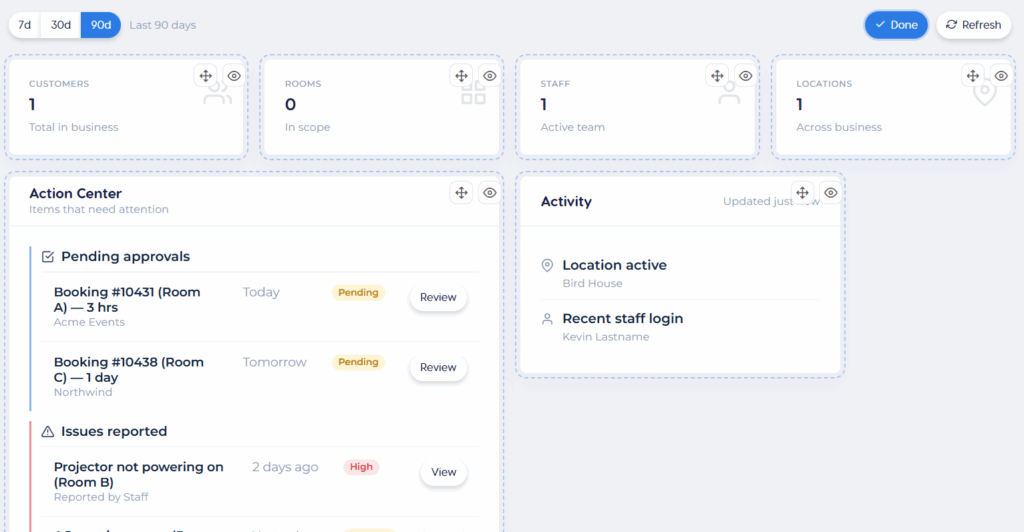
You currently allow the user to select widgets they want to activate, and select the order in which they appear. This is clumsy. Can you provide a feature by which the user can choose to edit the page, then manually drag and drop the position and activation of the widgets?
Response:
It’s not bad! The behavior of the drag-and-drop is a little unintuitive in action, but we think this has been enough of a challenge for this experiment.
Takeaways
We found that the LLM did a passable job of designing the UI of the dashboard. At times it required multiple attempts before it completed its assignments – which is not a huge issue.
With the challenge of drag-and-drop widget interface, the LLM did an ok job but it has a lot of room for improvement. We would want to spend significantly more time refining this feature if it were to ever see production. It goes to show that the LLM will build exactly what you tell it to, without much understanding of the user interactivity or intuitiveness of workflows.
Indeed, the largest criticism we had was that the LLM does not do a good job of understanding the user. It did not understand the assignment of the “Action Center”, and has repeatedly demonstrated only a surface level understanding of what makes a dashboard useful. It’s possible that if we were to provide a sufficient set of documentation describing user behaviors and preferences, then the LLM would make better choices about UX design and interactivity.
When asking an LLM to build a UI from an LLM, it’s important to understand how the LLM operates. The LLM by default will only apply the most basic, common denominator UI/UX principles. It will only know as much about your customers as you tell it, and even with that information will lack the human insight into how your users will respond. For that reason, collaboration with an experienced designer is crucial to producing “good design”. This is why so many vibe-coded UIs across the internet look the same.
도움이 필요하시다면 이런 글은 어떤가요?
Resources & Guides: Access helpful guides, tutorials, and code to build the tools you need for your business.
Open Core Access: Get 무료 access to the core software and tools. Use them as-is, or customize them with coding skills or a developer. As your business grows, you can purchase plugins to unlock more advanced features.